It’s been along time since my last update, but I’ve managed to measure the magnetron spectrum output using a Signalhound. I sent an email to Signalhound and this was their reply:
For quick hoppers (FHSS), you will probably need to turn image rejection off to catch the signal. This will speed up the sweep but will also pass the image frequency (21.4 MHz below frequency of interest). If you turn video bandwidth down to 6.5 KHz and RBW to 25 KHz, Power Average mode, then turn on Max Hold, you should be able to capture and measure the signal.
These suggestions pointed me in the right direction to get the Signalhound working the way I wanted. Unfortunately I think the signal is very rapidly changing frequency so the max hold suggestion is the only way to see the signal.
Here is the output after turning the magnetron on for 15 seconds at 100% power:

Here is the output after turning the magnetron on for 20 seconds at 30% power:
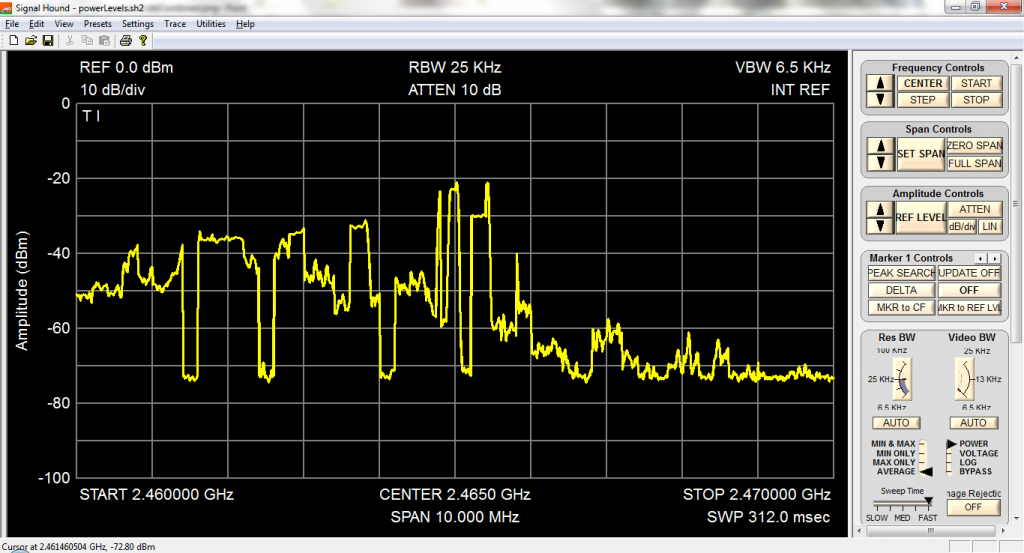
The pictures don’t tell the full story here. When the magnetron first turns on you see a peak around 2.465GHz which then slowly moves to the right as the magnetron heats up. Here’s the output after turning the magnetron on for 30 seconds at 100% power:

The flattening of the spectrum suggests that I’m right about the frequency shifting to the left as the magnetron heats up. Here are all 3 waveforms superimposed on each other:
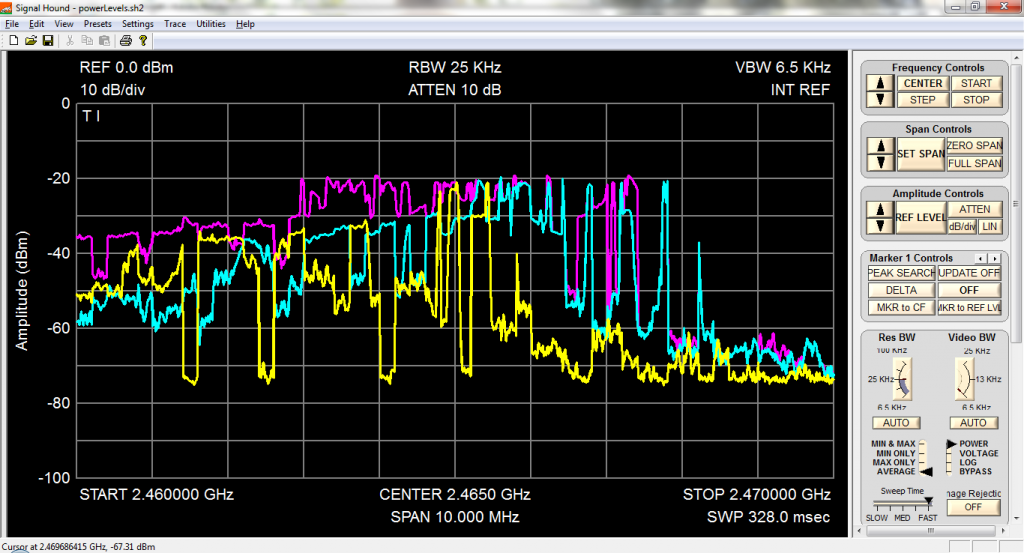
This result makes me think that it’s possible to minimize the frequency drift by cooling the magnetron. The next step is to try the same tests with a water cooled magnetron. Fortunately I have a surplus Astek D13449 under my desk to try once I reverse engineer it (no information is available from the company about it).